
In today’s data-driven education environment, feedback is more than just a formality — it’s a powerful tool for continuous improvement. Cyborg ERP’s Dynamic Feedback Chart Generation Module empowers institutions to visualize student feedback through interactive, real-time charts and analytics, giving educators and administrators a clear understanding of learning effectiveness.
This module converts raw student responses into intelligent visual insights, helping institutions identify teaching strengths, highlight improvement areas, and make data-backed academic decisions that truly enhance quality education.
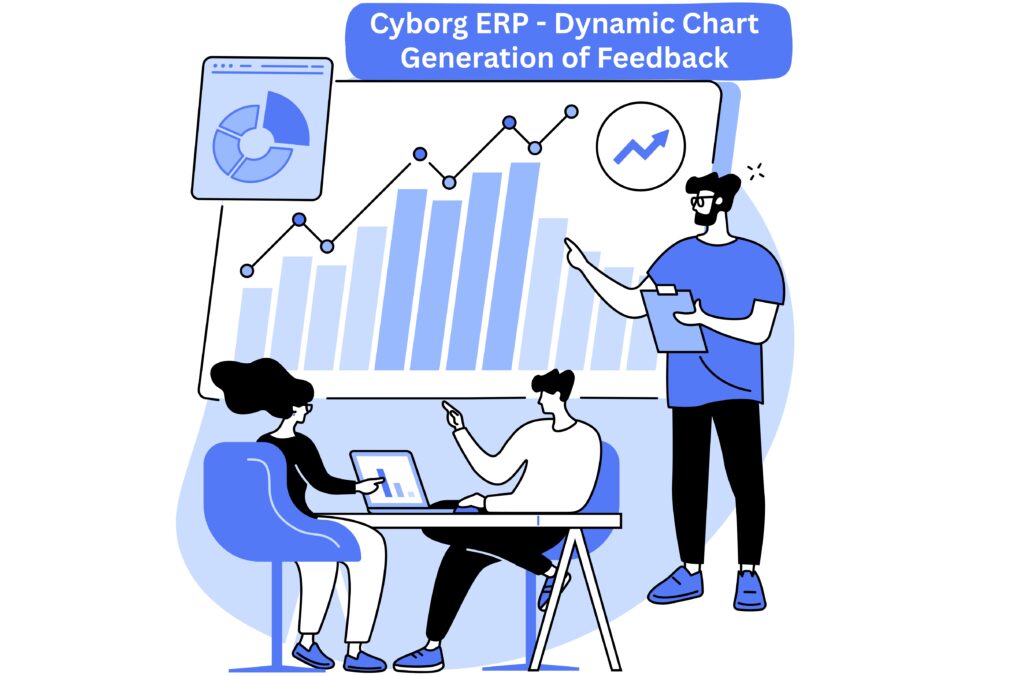
The Dynamic Chart Generation feature takes student input and instantly transforms it into visually appealing charts and graphs. Every response—whether about a subject, session, or faculty member—is reflected in real time, allowing stakeholders to monitor trends as they evolve. This real-time visualization ensures that institutions don’t just collect feedback, but actually see it come to life through data-driven representation.
Cyborg ERP offers multiple chart types—bar graphs, pie charts, line charts, and comparative analytics—that administrators can customize based on preference or purpose. Each chart dynamically adapts to new feedback entries, ensuring accurate and up-to-date visual summaries for any course, department, or faculty member.
The flexibility to filter and compare across semesters, subjects, or instructors makes feedback evaluation more meaningful and transparent.
For educators, these charts are more than just visuals—they’re a reflection of classroom impact. Teachers can instantly view how students respond to various topics, teaching methods, or sessions. Administrators gain a broader institutional view, identifying which departments or programs are excelling and which need support.
This data transparency ensures that feedback is used proactively—not just reviewed at the end of a semester, but continuously monitored to encourage timely improvements.
Dynamic feedback charts make it easier to interpret and act on data. Patterns of engagement, satisfaction levels, and topic-wise interest metrics help institutions:
By turning feedback into measurable visuals, Cyborg ERP helps academic leaders make smarter, evidence-based decisions that directly enhance learning outcomes.
This feature seamlessly integrates with Cyborg ERP’s Feedback Management Module, ensuring that every response collected through the platform contributes to the visual analytics dashboard. There’s no need for manual report creation—charts auto-generate and update in real time as new feedback arrives, saving time and ensuring precision.
Institutions can also export these visual reports for NAAC, NBA, or IQAC documentation, making accreditation processes more efficient and transparent.
Traditional feedback systems often stop at data collection. Cyborg ERP takes it a step further by converting that data into interactive visuals that inspire immediate action. When teachers and management can literally see how sessions are performing, improvement becomes natural, timely, and measurable.
This module not only enhances feedback transparency but also strengthens institutional accountability and academic excellence.